12 Best Ways To Become A Millionaire From Nothing
Let’s discuss how to become a millionaire. But what is the point of this?
The point is to build your wealth.
And one way to measure wealth is by becoming a millionaire.
So the goal of this article is to review 12 tips for becoming a millionaire.
Can you become a millionaire by 30? It’s a tough task. Maybe 40 is more realistic. But it is good to set high goals.
So, let’s get started with a little background information on millionaires. Then, how to become one.

Disclosure: At no cost to you, I may get commissions for purchases made through links in this post.
Millionaire Demographics
Is it a big deal to be a millionaire? I think it is. And I want to put some facts behind it. I sourced the chart below from the website DQYDJ.
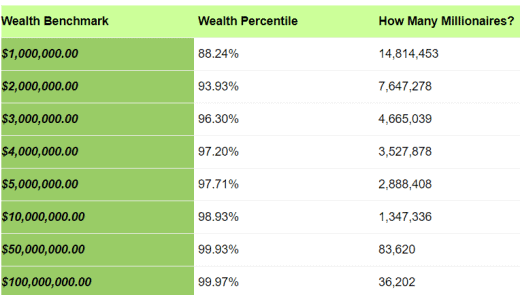
The chart tells us there are 14.8 million households in the United States that have achieved millionaire status. And if you have a million dollars, you have more money than 88.24% of all the households in the United States.
Let’s unpack this information regarding millionaire demographics.
Millionaires From The United States Only
First, this is only data for the United States. There are certainly millionaires in other parts of the world.
Rolling in the data from around the globe, the world wealth percentile would probably rise. Because the US is a developed country with more American millionaires in the population than other lesser developed countries.
Millionaire Households
Furthermore, the data represents households, not individuals. It is impossible to split up a household net worth by the individuals that live in that household.
The 1% Are The Wealthiest Millionaires
“We are the 99%” was a popular political slogan. I do not hear about it as much anymore.
The phrase directly refers to the income and wealth inequality in the United States with a concentration of wealth among the top-earning 1%.
Source: Wikipedia
According to the chart, you would need to accumulate a little more than $10 million dollars to make it into the 1%.
Finally, some people define the 1% based on income.
I’m a believer in the phrase, “it’s not what you make, it is what you have”. So I define the 1% based on net worth, not income. Just like the chart shows.
What Is A Millionaire?
Then by that definition, a millionaire is a household with at least a $1 million net worth. This certainly seems like an abundance of money to me.
What Is Net Worth?
Net worth is defined as the sum of the value of all assets minus any debts owed to others.
The Make-Up Of A Millionaire’s Net Worth
Some millionaires have most of their net worth tied up in their primary residence.
Assets are assets from my perspective. Whether they are held in cash, bonds, stocks, or real estate. The downside of having most of one’s million dollars in a primary residence is a lack of liquidity.
If you need cash in an emergency, it’s hard to sell your house. So some millionaires have more access to cash or liquid assets than others. This is what the phrase “asset rich, cash poor” refers to.
Millionaire Lifestyle
Do you think the average millionaire is living an extravagant lifestyle?
Do they jet around in a private plane and eat dinner out at fancy restaurants every night? I hate to burst your bubble, but they probably are not. If they were, they likely wouldn’t be a millionaire for very long.
As popularized in the classic book The Millionaire Next Door, their lifestyle and habits are mundane but effective for building wealth. It includes a comfortable home, modest automobiles, family vacations, and the like.
What Millionaires Really Have Is…
What millionaires have that others may not is a certain level of financial peace and security.
How To Become A Millionaire
With that background out of the way, let’s get on with the 12 tips on how to become a millionaire.

Many of my findings come from a research project I did last year.
1. Most Millionaires Got Rich By Making Money At A Young Age
I may be a little old school about this point. It doesn’t seem like high school kids work side jobs much anymore. I’m not an expert, that’s just my opinion.
Working a side job in high school starts to build a work ethic and responsibility at a young age.
I’m probably an extreme case. At some point in high school, I was:
- Delivering newspapers
- Doing landscape work
- Waiting on tables at a restaurant
It was nice to have cash in my pocket and not be dependent on my parents for spending money.
So, these are just a few ways millionaires make money at a young age.
2. One Of The Best Ways To Become A Millionaire: Increase Main Income
Becoming a millionaire starts with making money. The best way, in my opinion, to make the most money is from your primary career or business.
Get a good education in a marketable field and maximize the earnings potential.
Build millionaire skills both on the job and through formal training. Bring value to your employer or business and demand to be compensated for it.
Say your current employer won’t pay market value for your services? Then clean up your resume and find one that will!
My Perfect Resume is a great tool for creating customized, professional-looking resumes, and cover letters. So, take your job search to the next level.
3. Another Way To Become A Millionaire: Increase Side Incomes
I’m a little old school about this point too. I’m not a big believer in side hustles. I think they can distract from the primary sources of income for the average millionaire in the making.
There is that old expression “jack of all trades, master of none”. Let’s be realistic, you probably won’t become a millionaire because you are walking dogs or driving for Uber on the side.
But that is just my opinion. And I must admit the working world has changed a lot with the rise of the internet and gig economy.
Real estate rentals also seem to be a popular choice. Doing consulting or project work on the side is a good way to go if you have skills that are in demand.
So side hustling is another one of the ways millionaires make money.
Looking for your side hustle to make some extra cash. Check out Survey Junkie.
You won’t make a fortune doing surveys. But you can make your voice heard about new products and services. It’s fun and easy. Why not get paid for giving your opinion?
In my opinion, every dollar counts on your way to becoming a millionaire.
4. You Become A Millionaire By Managing Your Expenses
Research shows that most millionaires prepare a spending plan and stick to it. This is commonly referred to as budgeting. And it is often how millionaires manage their money.
If they don’t have a written budget, they have a solid understanding of where and what they spend their money on.
Most importantly, millionaires spend less than they make.
We all have to spend money. Just be smart about it.
One way I like to save money is by getting cashback on all of my online purchases from Rakuten. It’s free to join and by signing up through this link you get a $10 cash bonus!
That’s just $10 of free money in your pocket. Like I said before, becoming a millionaire means making the most of every dollar.
5. People Become Millionaires By Having A Plan For Every Investment Dollar
So now income is on the rise. And expenses are less than income.
Those elements create excess cash.
Millionaires are adept at putting excess cash to work in intelligent ways. I’m talking about the investing aspects of becoming a millionaire.
But first, everyone needs good information to make a millionaire investing plan.
Personal Capital is the tool I recommend to manage your money and make a plan for it.
And the best part of Personal Capital is that it is completely free to sign up and use.
With Personal Capital, you can:
- Track your net worth
- Track your cash flow
- Monitor your investments
Now you will have a FREE tool to track your net worth and make a plan for your money.
Let’s talk about a few of those ways that people become millionaires through investing.
6. Millionaire Tools Also Include Tax-Advantaged Accounts
The first place for excess cash is tax-advantaged accounts.
You likely know about the ever-popular 401k plan. And the Individual Retirement Account (IRA) in the US and their equivalents in other countries.
Whether it is the tax deduction or the tax-deferred investment gains, these plans are popular choices for millionaires and their investments.
The more money millionaires make typically means higher income taxes. And, they know this. So maximizing contributions to these accounts is a big priority for any millionaire in the making.
7. Becoming A Millionaire Means Minimizing Debt
Most millionaires get rich carry only two types of debt.
Specifically mortgage debt on their primary residence and/or debt related to a business enterprise or other real estate holdings. Once in a while, you might find a millionaire with some remaining student loan debt.
Millionaires prioritize debt reduction with their excess cash.
They target credit card debt and auto loans first, then student loans. Some will pay off the mortgage on their primary residence. Others will keep their mortgage.
My View On Millionaires And Debt
Personally, I have always been very debt-averse.
I recommend allocating excess cash to speed up mortgage reduction.
I like taking the sure thing. And with the recent changes in US tax law; there is less incentive to carry a mortgage if you do not need to.
Not everyone including Certified Financial Planners would agree with me on this. Especially with mortgage interest rates so low. It’s really a personal preference.
8. Become A Millionaire By Investing Money In Taxable Accounts
Now, debt has been minimized and contributions to tax-advantaged plans have been maximized.
Millionaires manage their money at this point by investing in taxable savings and investment accounts. This is money allocated to savings accounts, certificates of deposit, stocks, bonds, mutual funds, and ETFs. Doing this wisely can make you an investment millionaire.
Are you a regular reader here at Dividends Diversify? Then it shouldn’t come as a surprise that I believe people can get rich with dividends.
Often, millionaires in the making invest in dividend stocks for the passive income they provide. Dividends are just one of the best sources of income for the average millionaire.
Sometimes, millionaires like to handle these investment chores themselves.
Millionaire skills often include do it yourself investing. On the other hand, some millionaires prefer to have an investment professional handle this chore.
Do it yourself (DIY) investing is lower cost, but more time consuming and requires basic knowledge of investing principles.
Thus, you may enjoy the features and functions of the Webull stock app for buying and selling stock. For a limited time, Webull offers free stock to anyone who signs up and funds their account.
Webull offers free stock trades too. Thus, pay no commission or fees.

9. Millionaires Manage Their Money Through Automated Savings & Investment
Because most millionaires set and operate against a budget they know how much extra cash they will have each month. This allows for automatic savings and investing taking over.
Savings deductions for tax-advantaged accounts are automatically handled by the millionaire’s employer. And the remaining excess cash is swept to other taxable investment vehicles automatically.
How do millionaires manage their money? No messing around here. Consistency is the key to success.
Millionaires never miss of month of saving and investing. They do it automatically.
10. Another Tip To Becoming A Millionaire: Continuous Improvement
We can boil wealthy habits down to a few key skills.
- Making money
- Spending less than what is made
- Personal finance
Make financial luck come your way. Through reading, learning, and practicing these skills, millionaires learn as much as they can to make more, spend less, and manage their money effectively.
This is one of the best ways to become a millionaire. Millionaires have a continuous improvement mindset. They simply get better at what they do every day. That positive state of mind translates to success, wealth, and good fortune.
11. Making A Millionaire Plan
Armed with the 10 points discussed above, millionaires develop a personal money plan on what they will do in each area. The millionaire’s plan could be in writing or could just be a thoughtful process in their head.
Written plans with action items are a good idea for personal accountability. But not an absolute necessity.
The Millionaire Master Plan is an interesting “how to become a millionaire book”. The author became a millionaire by building a fortune from nothing. I read it recently and really enjoyed it.
Speaking of enjoyment…
12. Millionairism Means Enjoying The Journey
Yes. Millionairism is a real word. Merriam-Webster defines it as “existence or dominating influence of millionaires”.
When people become millionaires, I doubt their life satisfaction changes the day they reach $1 million in net worth.
So it is very important to enjoy the journey!
Why? Because it takes time to become a millionaire. You probably won’t become a millionaire overnight like some people will have you believe
The wealth building journey is about the process.
Furthermore, it is about learning.
Finally, wealth is about the self-satisfaction money can provide. And the process of improving your financial security each and every day.
Before I wrap up, let’s address a couple of questions.
I just mentioned it’s important to enjoy your journey to millionaire status. Why? Again, because becoming a millionaire takes time.
Research has shown the average age to become a millionaire for the first time is 49 years old. So, make your mantra for financial abundance to be “live in the moment and enjoy the journey”.
Next, let’s run some numbers. And see what it takes to save $1 million in 20 years as an example. And then see how much income that money can generate.
How Can I Save $1 Million in 20 years?
To have a $1 million in 20 years assuming a 9% average annual return on your millionaire investments, you must save and invest $1,497 each month. That is a lot of money to save, for sure.
Now you may better see why the average age of first time millionaires is 49 years old.
Saving $1 million in 30 years is a much more realistic goal. That takes a savings amount of $536 per month.
This is how the majority of people become millionaires by 50. Disciplined savings and investing following the points in this article.
Yes. There are exceptions to these rules. But that’s what they are. Exceptions by the talented and lucky few!
I don’t begrudge them. I congratulate and admire them.
How Much Income Will $1 Million Generate?
$1 million can generate a substantial amount of income. But the amount of income will depend on what you invest the $1 million in.
Let’s assume the $1 million is invested in dividend stocks with moderate dividend yields. Say, 4%.
Then, the $1 million will generate $40,000 in annual income. That is a nice amount of passive dividend income from your millionaire investments.
Editors note: The videos that play above and in the site’s margin illustrate the primary financial content found on Dividends Diversify. They are consistent with the category pages at the top of the site. And specifically highlight:
- Dividend stocks
- Investing
- Building wealth
- Money management
So, be sure to check out some of our other great articles.
Next, allow me to offer some concluding thoughts about today’s post…
How To Become A Millionaire: Recap
- Start making money at a young age
- Increase your career or business income
- Increase your side incomes
- Manage spending & live below your means
- Have a plan for every extra dollar
- Maximize savings in tax-advantaged accounts
- Minimize debt
- Invest the rest in taxable accounts
- Automate monthly savings and investment
- Improve your knowledge and skills
- Develop a plan
- Enjoy the journey
Millionaire Tools: Recap
Throughout the article, I mentioned a number of millionaire tools and resources. They are summarized here for your convenience.
- Build your best resume
- Take surveys for extra cash
- Get cashback on all your online purchases
- Manage all your money like a pro
- Get free stock from the Webull stock app

Very valuable insight here! I’m glad you laid out in the beginning to regarding primary residence. I agree that assets are assets. Liquidity is understandable. As long as your home is not underwater, it has positive value towards your overall net worth.
Hi SMM. I’m always a little torn on the primary residence. It certainly is an asset to be included in net worth. But there are so many costs associated with home ownership that it can limit a persons ability to build wealth. Tom
Haha we are totally in sync except yours US millionairism is more difficult to achieve because it is in US dollars and the Canadian dollar is weak right now!
I hadn’t thought of that. I’m curious what the millionaire demographics are in Canada now that you bring it up. Maybe I will research that and do some type of comparison analysis with the US. Tom
Hi Tom,
Great advice! As I’ve gotten older, this is what resonates the most with me: ” What millionaires have that others may not is a certain level of financial peace and security”. It’s not about cars and caviar, it’s more about being able to sleep soundly.
I also think that what you say about automating investments is critical. It’s the best way to be consistent, in my experience – set it, and forget it.
Cheers,
Miguel
Great points Miguel! Thanks, Tom
I feel like I do most of those things Tom but I’m nowhere near being a millionaire. A lot of it has to do with the fact that I’m late to the bandwagon, so to speak. Plus, I’m not as disciplined as I should be. But, those practices you mentioned are good for those of us striving to achieve millionaire status.
On a wholly separate note. I just changed the tagline to my blog and I just realized it’s very similar to yours. I wrote about the recent change and will post it soon.
Hey DP. Better late than never. Sometimes getting started is the hardest part and we all have bumps in the road along the way. I look forward to checking out the new tag line and your thoughts around it. Tom
Being knowledge about taxes is a very important skill that everyone should have. You don’t have to be a CPA to know how to take advantage of tax sheltered accounts and other simple things. Starting early also helps. More time in the market, gives you more time for your investments to build up. But even if one did not start early, they are still able to achieve the same outcome as long as they keep their spending under control for the most part. Thanks for sharing.
Thanks Daze. All good points. Hope you are doing great and well on your way to a million+! Tom
I’m a big believer in #3 with a small addition – make them primary income sources once they start throwing enough cash flow.
Yes. That is the ideal situation if a person can pull it off! Tom
Love it! It’s honestly all about repetition more than anything. If you can develop the pattern outlined above, then it’s only a matter of time. Nice post!
Who better to put the seal of approval on this post than the Millionaire Mob! Thanks for the kind words! Tom
This is a great post. I like how you differentiate between making a lot vs. saving a lot (it’s what you have, not what you make) – that point is something I think most middle-lower class Americans struggle with – they look at people making more than them and think that’s the difference. The issue is the blue collar millionaire is alive and well in America and it’s by saving regardless of their income.
Hi Dan. Thanks for stopping by and leaving your thoughts. You make a really good point. Financial security is in reach for most people if they put their minds to it over the long run. Tom
Great Post.
Thank you. Tom
Hi we’re really trying to get paid all our odds and ends.and debts and to buy our home.so we just won’t have another big bill to find to pay.and once you’ve paid off your mortgage.thats the end of that.then you can concentrate on your other things and other bills and debts and budgeting.sorting all debts that you haven.
Yes. I agree. Prioritizing paying off your mortgage is a good idea. It then allows you to focus the extra cash going to mortgage payments on other things like saving and investing as you say. Tom
I believe that one of the most important things is having a mentor! Someone who is already a millionaire and is willing to take time to invest into you to show you how they did it.
-Shawntel
Hi Shawntel. You are so right. Learning from those who have achieved what one is trying to accomplish is a great formula for success in many areas of life. Including money! Tom
Glad to say the points you made, especially Nos 4,5, 11 and 12 are what I have lived by in the last decade and it made becoming a millionaire as easy as ABC, at least in the local currency. Anyone can do it with a little determination.
Thank you for the encouraging remarks! Tom
Hi Tom, Who doesn’t like to be a millionaire? We all do, right! But, there’s no easy way to it. Thanks for sharing some practical ways to get rich. Increasing Income and managing debt wisely are surely the two crucial keys to success in life. One should build a passive income stream at an early age so as to gain in the longer period.
Oh so very true! Thank you for stopping by and commenting! Tom
Truly great post Tom! I love the step where you state that Millionaires have a plan for every extra dollar. It is so true, the millionaire mindset is focused on growth and improvement.
Thanks for the kind words, Michael. Glad you liked it. Nice to hear from you and thanks for stopping by! Tom
Great Post Tom! The key thing is starting early I started at 9 years old by deciding to bank 1/2 of every dollar I made. Was living under my parents roof so had no expenses or costs, except spending money. I ALWAYS had money in my pocket, and paid cash for everything. Whether it was First Communion, Birthday, Graduation, Paper Routes, Dishwasher, Caddie, Mowing Lawns, etc. 1/2 ALEAYD was tucked away. When I got older I started paying cask for everything or I didn’t buy it, so never had debt until secondary school tuition, and my first mortgage. I really liked the feeling and security. As I got into my twenties I started investing in stocks. Over the next three decades it really added up and was there by 50 years old. Too many kids just are not shown a work ethic or a path to save today. It’s not taught in our educational systems. It becomes a way of life and then you are secure, when everyone else talks about retiring in maybe 15 or 20 years when they “ have enough to afford it. I tell them that was their choice for the last 40 or 50 years. You either pay the Piper then or pay him later. Great Article
Hi Rick, Thanks for your comments. You are right on with your thoughts and everything you have done. Congrats! And, thank you for the kind words. Tom
Why do I get the feeling this was written to satisfy politicians? Invest in Taxable accounts? Yes, some taxable accounts give you money back on how much you invest, but you are still being taxed on it at some point.
And since when do the 1% count as millionaires? They are well above that in the billionaire range. The reason they are that rich isn’t because they have a few investment accounts, it’s because they own everything and receive monthly income in the millions from renting out services or products, or selling necessary products and such. Sure, they invest too, but they really hardly use much of the monthly income they have coming in from consumers.
Most or all of these tricks will work well to help consumers following them retire decently, but you still need money in the first place to invest. Money that you afford to tie up for long periods of time and lose quick access too. And that is the problem with about 50% of the people in this country these days. They are living paycheck to paycheck, giving everything away to subscriptions, rentals, and vehical leases, or simply have nothing left after paying the bill’s. They simply have nothing to invest, and own no assets.
Hi Shawn. Thanks for commenting. You make some good points. But, I can assure you that it wasn’t written to satisfy any politicians. I don’t even know any! Tom
I agree with your stance on debt. Pay it down from the worst debt moving up to mortgage debt. We paid our mortgage off once, but now have another one after the house move. All our efforts now go into becoming mortgage-free again.
Good luck Penny! It sounds like you are are on the right path! Tom
I don’t know how long it’s gonna take but I will be a millionaire. and if your tips help me in my journey I will be thankful to you.
thanks a lot
You will make it Ghani. Just keep learning about money. Be consistent with your savings and investments and it will happen! All the best. Tom
I would question whether millionaire status is actually a goal nowadays? A million dollars won’t see you retired for the rest of your life. It’s not actually a great deal of money. Why not aim for at least $3m if you want to to be comfortable going forward. What do you think?
Hi Penny. I totally agree. We have to set our goals somewhere and $1 million is just a starting point. Although, it is a very challenging starting point for many of us. That said, anyone with the ambition to achieve $1 million can and certainly set their goals higher if at all possible. Cause, like you, say, “a million ain’t what it used to be”!
hey there. these 12 steps are so much valuable. and I love your idea where you said millionaires improve. and it’s so true in order to become a millionaire, first of all, we have to improve our daily life, our surroundings, and our thoughts and then, of course, we can be a millionaire or even a billionaire but it starts with a great shift of improving ourselves.
For sure. You sound like me, Ghani. We both seem focused on personal development and self-improvement. They are very much related to our money! Tom